Saturday 29 December 2012

An Alternative Traffic Speed-Density Relationship

Previously we've examined a macroscopic traffic model, which contained, as one of its model equations, a relationship between speed and density. That relationship is reproduced here:
$$v = v_f (1 - \rho/\rho_j),$$ where
\(v\) = vehicle speed (m/s);
\(v_f\) = free flow speed (m/s);
\(\rho\) = vehicular density (veh/m); and
\(\rho_j\) = jam density (veh/m), the average vehicles per metre in stationary traffic.

Here I present an alternative speed-density relationship based on headways. Headway is the spacing between vehicles, usually as a time, but it can also be expressed in terms of distance.

In addition to expressing the above headway concepts, the new speed equation should satisfy two conditions. At zero density, the speed should be \(v_f\), and at the jam density, the speed should be zero.

But first we will develop the headway concept. As stated above, headway is usually expressed as a time. That's a good starting point. If we denote temporal headway as \(h_t\) (s/veh), then we may write that: $$h_t = 1/q = 1/\rho v,$$ or rearranged: $$v = 1/\rho h_t.$$ There is a difficulty with that relationship because at the jam density, the speed is still non-zero. However, note that \(1/\rho\) is the distance per vehicle. If we replace \(1/\rho\) with \(1/\rho-1/\rho_j\), then the equation becomes: $$v = \frac{1}{h_t}(1/\rho-1/\rho_j),$$ and the speed at the jam density is zero.

The only issue left with the above equation is that the speed is undefined at zero density, instead of being \(v_f\). To overcome this and ensure that the speed is \(v_f\) at zero density, I've developed this equation: $$v = \frac{1}{\frac{1}{v_f} + \frac{h_t}{(1/\rho-1/\rho_j)}}.$$ Unfortunately it still suffers from being undefined at zero density, but it's now more easily overcome. The final formula for speed is: $$v = \frac{1}{\frac{1}{v_f} + \frac{h_t\rho}{(1-\rho/\rho_j)}}.$$

We have previously analysed the original flow-density relationship, and we will do similar here. Thanks the the equation \(q=\rho v\), in this alternative formulation, flow is given by: $$q = \frac{\rho}{\frac{1}{v_f} + \frac{h_t\rho}{(1-\rho/\rho_j)}}.$$
The analysis to determine capacity for this relationship is more involved, but definitely solvable. The critical density is given by: $$\rho_c = \frac{1-\sqrt{h_t v_f \rho_j}}{1/\rho_j - v_f h_t}.$$ Capacity may be calculated by using the critical density in the flow equation above. The relationships are displayed in this graph for \(\rho_j\) = 1/7 veh/m and \(h_t\) = 0.7 s/veh:
An alternative flow-density relationship based on headways.

Interestingly, the original flow-density relationship is approximately recovered when \(h_t\) = 1/4 s/veh. That is encouraging, and means that this alternative speed-density relationship might be considered as a generalisation of the original one. But why is it the specific value of \(h_t\) = 1/4 s/veh? Well, after some rearranging of the final speed formula above, we can write it as: $$v = \frac{v_f (1-\rho/\rho_j)}{1+\rho(h_t v_f - 1/\rho_j)}.$$ The top part happens to be equal to our original speed equation, so to make them completely equal, we just have to satisfy \(h_t v_f = 1/\rho_j\). Finally, if \(v_f\) = 27.78 m/s (100 km/h), and \(\rho_j\) = 1/7 veh/m, then \(h_t\) should be 0.252 s. No wonder a headway of 0.25 s appeared to give the original speed-density relationship.

Saturday 22 December 2012

Discretising Base Traffic Model Equations

This post is a followup of these earlier posts. Here we discretise the traffic model equations to let us solve them numerically. Here are the model equations (including boundary conditions) all together in one place:
$$q = \rho v,$$ $$\frac{\partial \rho}{\partial t} + \frac{\partial q}{\partial x} = S(x,t),$$ $$v=v_f ( 1 - \rho/\rho_j ),$$ $$S(x,t) = 0,$$ $$\rho(x,0) = 0,$$ and $$\rho(0,t) = \rho_j/4.$$ where
\(q\) = traffic flow rate (veh/s) past the point;
\(\rho\) = vehicular density (veh/m);
\(v\) = vehicle speed (m/s);
\(\partial\) indicates partial differentiation;
\(t\) = time (s);
\(x\) = distance (m) along road;
\(S\) = vehicles entering (+ve) or leaving (-ve) the road (veh/m/hr);
\(v_f\) = free flow speed (m/s); and
\(\rho_j\) = jam density (veh/m), the average vehicles per metre in stationary traffic.

Note that we've set \(S(x,t)\) to zero. This means that no vehicles are leaving or entering the road apart from at the ends.

The presence of the very simple equation for flow, \(q\), means that we can eliminate flow from the equations altogether. When a value for flow is needed, we can just multiply density and speed together. As we progress, we may (or may not) find it desirable to do the same with speed. With flow removed, the main equation becomes: $$\frac{\partial \rho}{\partial t} + \frac{\partial \rho v}{\partial x} = S(x,t).$$ My favourite discretisation method is to use control volumes - the finite volume method. The first step is to divide the domain into cells, or control volumes. Here is how we will do that:
Discretisation grid for our traffic equations, showing coordinates for cells 1, i and n.
where a trailing minus sign indicates the left boundary, and a trailing plus sign indicates the right boundary. Because the right boundary of one cell is the left boundary of the next cell, we have \(x_{i+} = x_{i+1-}\). Dots indicate the location used to calculate representative model values contents for each cell.

There is also a time dimension, and we'll refer to the current time with \(t_c\), the target, or future, time with \(t_f\). The time step of our discretisation is given by \(t_f - t_c = \Delta t\).

We will discretise our density equation by integrating it over the volume of each cell, 1 to \(n\). Since we have two dimension, \(x\) and \(t\), the integration over the volume involves two integrals.

Body Cells: 2 to n-1

First we'll integrate over space: $$\int_{x_{i-}}^{x_{i+}}\frac{\partial \rho}{\partial t}\,dx + \int_{x_{i-}}^{x_{i+}}\frac{\partial \rho v}{\partial x}\,dx = 0.$$ The first integral is approximated using the rectangle rule with one rectangle using the midpoint approximation (\(x=x_i\)). The second integral simplifies thanks to the fundamental theorem of calculus. Applying those (and explicitly writing the function arguments for \(\rho\) and \(v\)), we get: $$(x_{i+}-x_{i-}) \frac{\partial \rho(x_i,t)}{\partial t} + \left[\rho(x,t) v(x,t)\right]_{x_{i-}}^{x_{i+}} = 0.$$ Now we'll apply the time integral from the current time, \(t_c\), to the future time, \(t_f\). For the second integral, we use the rectangle rule, with top left corner approximation (\(t=t_c\)): $$(x_{i+}-x_{i-}) \left[\rho(x_i,t)\right]_{t_c}^{t_f} + (t_f-t_c) \left[\rho(x,t_c) v(x,t_c)\right]_{x_{i-}}^{x_{i+}} = 0.$$ Next, we rearrange it to have the density at the future time on the left, and everything else on the right: $$\rho(x_i,t_f) = \rho(x_i,t_c) - \frac{t_f-t_c}{x_{i+}-x_{i-}}\left(\rho(x_{i+},t_c) v(x_{i+},t_c) - \rho(x_{i-},t_c) v(x_{i-},t_c)\right).$$

Left Boundary Cell: 1

The left boundary equation doesn't need to be obtained by integrating as it is given by the existing boundary condition: $$\rho(0,t) = \rho_j/4.$$

Right Boundary Cell: n

For the right boundary cell, we can reuse the equation from the body cells, but updated to refer to the last cell's coordinates (\(i\rightarrow n, x_{i+}\rightarrow x_{n}\)): $$\rho(x_n,t_f) = \rho(x_n,t_c) - \frac{t_f-t_c}{x_n-x_{n-}}\left(\rho(x_n,t_c) v(x_n,t_c) - \rho(x_{n-},t_c) v(x_{n-},t_c)\right).$$

The next step in this thread will be solving these discretised equations.

Saturday 15 December 2012

Smooth Minimum and Maximum

The functions we examine in this post are closely related to p-norms. Lets say we have two equations that describe aspects of a relationship. For example, we might describe the selling price of an item in terms of a discounted price, \(d\), for small purchases, and a lower bound price, \(u\), for bulk purchases. In that case, we might have two equations to describe price: $$d(x)=202-2x,$$ and $$u(x)=150,$$ where \(x\) is the number of units purchased in a single transaction. In this case, it might be fine to simply decide the selling price, \(p\) as $$p(x) = \max(d(x), u(x)),$$ but what if we want a formula for the selling price that has continuous derivatives? (i.e. is smooth) Well, the formula I found in an attempt to do this is: $$m(x, s) = (d(x)^s + u(x)^s)^{1/s},$$ where \(s\) is the 'strength' of the maximisation.

The above formula is basically a p-norm (and is the Euclidean norm when \(s\) = 2). Here's a chart of it in action on \(d\) and \(u\) with \(s\) set to 2, 4, 6 and 8:
Example of a smooth maximum function for combining formulas.
The chart shows that a higher strength, \(s\) leads to a 'tighter' maximum. In the limit as \(s\) goes to infinity, we actually obtain the plain \(\max\) function. But what happens at higher unit quantities? Specifically, what happens when one of our inputs is negative? Well, that's shown here:
Example of the effect of a negative input on the smooth maximum.

That's not so good. The even strengths stay above both inputs, but diverge further and further above the intended maximum. The odd strengths (only one shown) start to trend towards the negative input, because towards the right, it is the largest in absolute value.

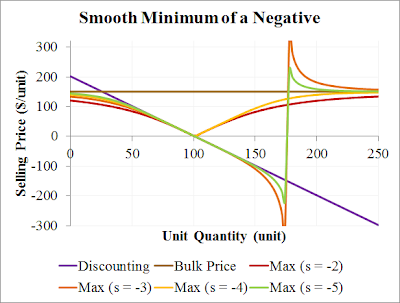
Before we attempt to deal with this issue, let's look at another interesting behaviour. Let's consider negative strengths. This chart shows strengths of -2, -3, -4 and -5:
A negative strength produces a smooth minimum function!

That's a convenient way to take the continuous minimum! And what happens when we feed in negative inputs? Well, it gets a little crazy:
A smooth minimum of a negative input does not look pretty.

So then, how might we deal with negative inputs? One way would be to transform inputs from the full number line onto just the positive half. To do that we turn to exponentiation. So here's the updated continuous maximum/minimum function, generalised to any number of functions: $$m(x, s) = \ln_b\left(\left[ \sum_{i=1}^q (b^{f_i(x)})^s \right]^{1/s}\right),$$ where \(b\) is the base of exponentiation. So, let's test it. I initially tried \(w = e\), but ran into overflow issues, and instead have used the value 1.01. Here is the maximum and minimum of positive and negative inputs, with \(s\) being 2, 5, -2 and -5:
A smooth minimum and maximum function that works with negative inputs.

One final thing. To use this in Lisp on individual values, evaluate this (with MathP):

(defun smooth-min-max (b s &rest vals)
    "Smooth minimum (s < -1) or maximum"
    #M log(reduce{#'+ vals :key fn(v) (b^v)^s}^(1/s) b))


And to construct a function that minimises or maximises other functions, try something like this:

(defun smooth-min-max-lambda (b s &rest funcs)
    "Returns a function that calculates a smooth min/max of the

given base and strength. If b > 1, positive s does maximisation,
negative s minimisation. If 0 < b < 1, it is reversed."
    (assert (or (< 0 b 1) (> b 1)))
    (assert (not (zerop s)))
    #M fn(&rest args) log(reduce(#'+ funcs :key fn(f) (b^apply(f args))^s)^(1/s) b))


Enjoy!

Saturday 8 December 2012

Analysis of Speed Density Flow Relationship

These notes have been inspired by a recent paper by Rahman, Ben-Edigbe and Hassan*. In it they analyse the speed, density and flow relationship.

The equations given in this previous traffic modeling post include an algebraic relationship between speed, density and flow: $$q=\rho v$$ and $$v = v_f(1-\rho/\rho_j),$$ where
\(q\) = flow rate (veh/s);
\(\rho\) = vehicle density (veh/m);
\(v\) = vehicle speed (m/s);
\(v_f\) = free flow speed (m/s), nominally 27.78 m/s;
\(\rho_j\) = jam density (veh/m), nominally 1/7 veh/m.

Given the above equations, it is possible to eliminate \(v\). That is, flow can be expressed in terms of density by using the speed equation:
$$q=v_f\rho ( 1 - \rho/\rho_j ).$$ This is a quadratic, and it has a maximum. Because it's a quadratic, this means that the inverse relationship is not a function, as it's multi-valued (one flow rate may be associated with two densities). Here is a graph of the flow-density relationship with the nominal values:
Flow is a function of density. At 0 density, flow is zero. As density increases, flow increases to a maximum (called capacity), then decreases, eventually reaching 0 when the density is the jam density.
Relationship between flow and density, showing key values.

The maximum point on the flow curve happens to be the capacity of the roadway. We find the maximum point by differentiating the above and solving for slope equals zero. The critical density, \(\rho_c\) (the density at which the flow rate equals capacity), is found to be \(\rho_j/2\), and the capacity, \(q_c\), is given by:
$$q_c=v_f\rho_j/4.$$ With the values mentioned above (\(v_f\) = 27.78 and \(\rho_j\) = 1/7), the capacity is 0.99 veh/s, which while high, is in the right order of magnitude for freeways (which I think is around 0.5 to 0.7 veh/s).

The next post on this topic will be model discretisation.

* The paper is Rahman, R., Den-Edigbe, J. E., and Hassan A. (2012), Extent of Traffic Shockwave Velocity Propagations Induced by U-Turn Facility on Roadway Segments. 25th ARRB Conference. Mentioned here.

Saturday 1 December 2012

Macroscopic Model of Traffic

I work in the Intelligent Transport Systems (ITS) industry, at Transmax, and completed a PhD in applied mathematics at QUT. So it should come as no surprise that I want to combine and explore the two areas. To combine my two interests, I have investigated macroscopic models of traffic flow.

This post presents a simple model of traffic flow. It will form the baseline for further work and modifications. I learned of these equations from this paper by Paul Ross, published in 1988.

Model Equations

The first equation comes from the definitions of flow, density and speed:
$$q = \rho v,$$ where
\(q\) = traffic flow rate (veh/s) past the point;
\(\rho\) = vehicular density (veh/m); and
\(v\) = vehicle speed (m/s).

The above equation states that the number of vehicles that will pass by a point is equal to the density of traffic at that point times the speed of vehicles at that point. That is, flow rate increases with density and speed.

The second (partial differential) equation was given by Lighthill and Whitham in 1955. It describes the conservation of vehicles:
$$\frac{\partial \rho}{\partial t} + \frac{\partial q}{\partial x} = S(x,t),$$ where
\(\partial\) indicates partial differentiation;
\(t\) = time (s);
\(x\) = distance (m) along road; and
\(S\) = vehicles entering (+ve) or leaving (-ve) the road (veh/m/hr).

The third equation describes vehicle speed. The simplest relationship would have to be linear relationship between speed and density, as reported by Greenshields in 1934. This speed equation gives a free flow speed at zero density, and zero speed at the jam density:
$$v=v_f ( 1 - \rho/\rho_j )$$ where
\(v_f\) = free flow speed (m/s); and
\(\rho_j\) = jam density (veh/m), the average vehicles per metre in stationary traffic.

Let's say that the free flow speed is 100km/h. That means \(v_f = 27.78\) m/s. Also, let's assume that the average vehicle length is 5 metres, and that in a jam, they are spaced 2 metres apart. That means \(\rho_j = 1/7\) veh/m.

The equation for speed has an important effect on the traffic in the simulation, and has received a lot of attention in the literature. Various forms have been presented in the literature, and we will look at some of them in the future.

Boundary Conditions

A model with a partial differential equation is not complete without boundary conditions. There are a few options for us, but we must specify two boundary conditions - one for a point in space, and one for a point in time. First, some notation to help us specify the boundary conditions. We will refer to flow, density and speed as functions of two variables by writing \(q(x,t)\), \(\rho(x,t)\) and \(v(x,t)\).

Before we actually specify the boundary conditions, note that we have one partial differential equation, and two algebraic equations. With the two algebraic equations we can translate density to/from speed, and calculate flow from density or speed (but not the reverse - we'll see why below).

The time condition is usually chosen to be for time zero. We might choose that initially:
$$\rho(x,0) = 0$$ for all \(x\). In this model, it is equivalent to specifying \(v(x,0) = v_f\).

For this model, the space condition can be specified in terms of density or speed, as we can use the equations to determine the unspecified measures. Let's choose:
$$\rho(0,t) = \rho_j/4.$$ I don't think it's very important, but let's say that this condition overrides the time condition at \(x=t=0\).

In the future we may change the space condition to be a function of time, for example:
$$\rho(0,t) = \frac{(1+sin(2\pi t/T))}{2}\frac{\rho_j}{4}.$$

What's Next?

In another post we will analyse the relationship between speed, density and flow. After that we'll discretise the model equations so we can solve them numerically. And after that we may investigate the effect of different speed equations on model behaviour.

P.S. Thanks to MathJax and My technical memo for the script to render equations.